Service Level Objectives at Weave
First the elephant in the room: yes it really did take us 4 attempts to get our automated SLOs right. While that may seem embarrassing, we are actually happy to share our SLO journey so that we can hopefully help you avoid the same mistakes.
This article is going to focus entirely on our performance issues with SLOs. Most notably, it does not dive into SLO Alerting at all.
If you already understand what SLOs are you can click here to jump to the meat of how we got it wrong so many times
If you just want to get it right the first time, you can click here to jump to the our final attempt
What we did right
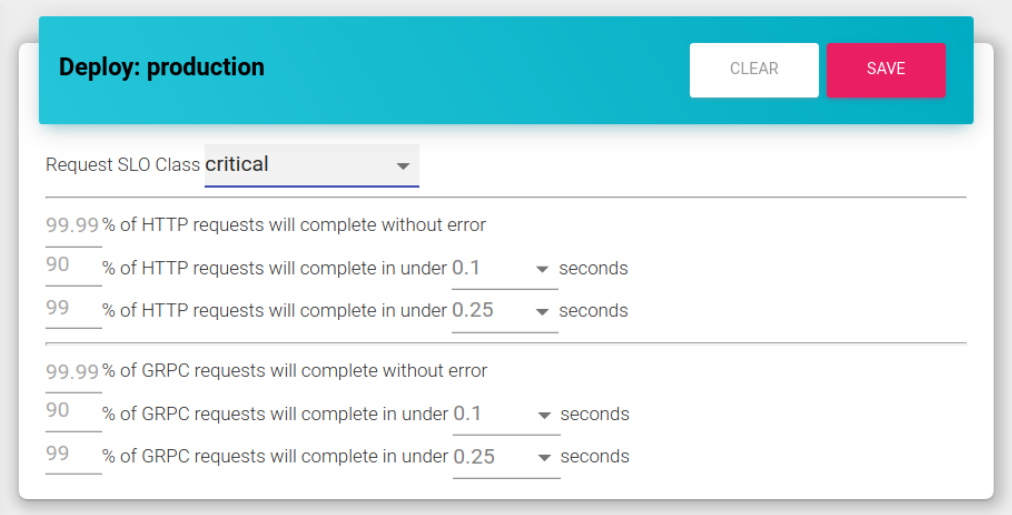
From the first release, our developer experience for setting SLOs has been as simple as possible. We built a dynamic web form to enable developers to set objectives using a full sentence objective statement.
We feel that something as simple as using this kind of input form has helped developers understand what they are trying to accomplish with every objective. We also chose to make several predefined “classes” so that developers could opt in as easily and with as little config as possible.
What we did wrong
- Not understanding the massive amount of data some services could have over 28 days
- Relying too heavily on multiple recording rules
- Improper Aggregation
Preamble: What Is An SLO?
We won’t dive too deeply here since there are entire books and blog articles around SLOs. But the short version is that Service Level Objectives are a tool that you can use to help understand the stability of your services and how much user patience you have left to spend.
Now, that last statement might seem odd. Why would we think of our user’s patience like a currency? And why in the world would we want to spend it?
We know that in the tech world we are often asked to move fast and break things. Even at fairly established companies this is a common practice to ensure we are innovating. SLOs are one way that we can balance “moving fast” and “breaking things” so that we don’t drive our users away. By having a sort of health guage around the recent history of our service we can know when it is the right or wrong time to test out a new behavior or do something risky. And of course we can use SLOs as a fairly universal way to judge the overall health of a service.
Choose an Objective
- Decide what metrics you will track
- We will use HTTP availability for this example
- For us, this means we are going to basically put our HTTP requests into two buckets:
- requests that return an HTTP response code that are in the
5xxrange - requests that return any other HTTP response code
- requests that return an HTTP response code that are in the
- Choose a time frame for the objective.
- We will use 28 days for this example
- Choose a percentage of requests you expect to pass
- We will use 99% for this example
With all of these choices made, we can create an objective statement to help guide our calculations:
Objective: Considering the last 28 days of data, 99% of HTTP requests should have completed without error
Or, put more simply and directly:
Objective: 99% of HTTP requests will complete without error
Basic SLO Calculation
An SLO Error Budget is actually the result of a fairly simple calculation. Let’s start with a very simple and generic slo calulation:
- 1,000 total events have happened
2events havefailed- Our target SLO is 99% “success” so we
budgetedfor 1% of our requests to error. 1% of 1,000 is10events that webudgeted
Given these numbers we can follow the standard SLO formula to figure out what our current remaining SLO budget is. The formula looks like this:
(budgeted - failed)   (10 - 2)
------------------- = -------- = .8 or 80% budget remaining
     budgeted            10
In this example, we have 80% of our budget. Or in other words, we could have 8 more failed events and still
not go over budget. In terms of our customers patience, we can essentially act as though we still have plenty of patience left. If we needed to do something risky with this service, now is still a good time.
Detailed SLO Process
Hopefuly the basic calcuation have helped you understand the calculation. But it glossed over a lot of the details in the SLO process. Here is a more detailed process you might follow to generate SLO metrics using any actual metrics gathering system.
- Choose an objective to measure
Example:
HTTP Availability- The number of HTTP requests that are completed without failure. - Choose an objective percent to reach
Example:
99percent success rate, we will track this aspercentage_as_decimal = .99 - Gather the total number of events in the window.
Example:
total = 10000requests were handled over the last 28 days This number needs to come from your service metrics. Prometheus examples are shown later in this article. But SLOs can come from any data or metrics system - Calculate out the number of requests we will have
budgetedfor failure by using the percentThis is calculated as
budgeted = total * (1 - percentage_as_decimal).Example:
budgeted = 10000 * (1 - .99)budgeted = 10000 * (.01)budgeted = 100
- Gather the number of failed events in the window
Example:
failed = 2requests failed in the last 28 daysThis number needs to come from your service metrics. Prometheus examples are shown later in this article. But SLOs can come from any data or metrics system
- Calculate the SLO budget % remaining
This is calculated as
(budgeted - failed) / budgetedExample:
budget % = (100 - 2) / 100budget % = (98) / 100budget % = .98 = 98% of the budget remains
This flow works the same regardless of the specific objective being tracked or the system used to Gather the data. Weave’s HTTP and gRPC metrics are calculated using metrics we already gather using Prometheus and the rest of the article is very Prometheus specific. But you could follow these steps for any metrics system.
Weave’s 4 attempts at SLO Automation
Now we get to the bulk of the article. Here we include a detailed accounting of all our steps at implmentating SLOs. We tell you what worked, what didn’t, what we got right, and what we misunderstood.
Attempt 1: Just stick the query in and let Prometheus sort it out
It’s actually fairly trivial to write a Prometheus query that can calculate all the SLOs for all your applications. Especially if you are fine with using the same objective for every application and you only have a small number of applications. A sample query for an all-in-one slo metric might look something like this:
(
   ( sum(increase(http_timer_count[28d])) by (app) * .01 )
   -
   (
     ( sum(increase(http_timer_count[28d])) by (app) )
     -
     ( sum(increase(http_timer_count{code!~"5.."}[28d])) by (app) )
   )
 )
/
( sum(increase(http_timer_count[28d])) by (app) * .01 )
Now, there are a lot of assumptions in this query:
- You want to calculate the remaining budget for “HTTP Availability”
- You want to use the last
28 daysof data - You have a Prometheus
Countercalledhttp_timer_countwith at least the labels ofappandcodeset. - You are fine with all Applications targeting an HTTP success rate of
99%. This is where the.01came from.
All that said: Yes the above query would absolutely work and could give you quick and easy insight into which of your applications are too volatile or are under-budget.
So, this is a nice, simple query that could get us an SLO for all our applications at once. Why didn’t we stop there at Weave?
Hard-Coded Objective For All Apps
Using one query for applications means that every application has to have the same metric. In our example, this means that every application is setting a 99% success rate SLO
This just doesn’t make sense. A major point of SLOs is to set something realistic and achievable. Not all apps have the same level of importance. It may be valid for some to have much lower, or higher SLOs than others do.
Performance
Running this query for just one point in time for our applications means that Prometheus needs to get the last 28 days of data for all of our over 400 microservices.
- This is simply a massive amount of data to process. Specifically the
increasefunction in Prometheus needs to go over each data series that has ever existed in the last 28 days to account for breaks in monotonicity. That is: counters resetting to 0. In Prometheus, counter resets are normal and common and are usually due to things like app restarts.
This is a massive amount of data to need to aggregate. So much in fact that we were simply unable to run this query in our system. It required too much memory and took far too much time to be useful. And just calculating this for one moment in time isn’t really that useful. What we really want is to track SLOs over time and correlate drops in budget with notable events in the system.
And this is when we use the http_timer_count which doesn’t include any sort of latency bucketing. Latency SLOs would need to use the slo_timer_bucket metric which
contains 100 times more data since it is a histogram type metric in Prometheus.
All this means that this attempt at SLO budgets at Weave was basically over before it started.
Attempt 2: Per-App Generation
But we weren’t ready to give up yet. We thought that if can’t run the query for every app at once, we might be able to simply take the same query, and run it for each app individually. This would mean that prometheus wouldn’t have to load as much data at once.
So, here is the updated query. We simply added an app= filter and removed the now useless by (app) clause. Since our query already filters by app we don’t need the grouping.
(
   ( sum(increase(http_timer_count{app="feature-flags"}[28d])) * .01 )
   -
   (
      sum(increase(http_timer_count{app="feature-flags"}[28d]))
      -
      sum(increase(http_timer_count{app="feature-flags",code!~"5.."}[28d]))
   )
)
/
( sum(increase(http_timer_count{app="feature-flags"}[28d])) * .01 )
Now we are getting somewhere! Not only can the query above actually complete when we execute it, but we now have a chance to set a per app objective; that’s a win-win scenario!
Performance
However, even though our new queries could run and actually complete, they were far from performant. Depending on the exact service, any single SLO query would take anywhere from ~1.5 seconds to upwards of 8 seconds to run. This means that while we could now get a remaining SLO budget for any app, trying to load a chart of that budget over time would take minutes to load because that same 1.5 to 8 second query would have to run for every point in the chart. This could be hundreds or thousands of times for one chart render.
Fix: Record it!
Some quick Googling pointed us at Prometheus Recording Rules as a possible solution to our woes. In short, Prometheus allows you to write special rules that configure it to run a query, and save the result back into itself.
This means that we could configure our SLO queries as recording rules and then just query the result metric back out. So Prometheus could track all our SLOs all the time and when we wanted to chart them, all we had to chart was one metric.
An example recording rule for our feature-flags SLO above might look like this.
This is still just “Attempt 2”. Please do not take the rule below and use it. While it does work, keep reading to see why it may not be a reliable method.
Also, if you are looking at the the record rule name and thinking it’s to big, you are right. That also will be addressed later.
groups:
- name: slos
  interval: 1m
  rules:
  - record: slo:feature_flags:request:http:availability:slo:error_budget
    expr: |
      (
         ( sum(increase(http_timer_count{app="feature-flags"}[28d])) * .01 )
         -
         (
            sum(increase(http_timer_count{app="feature-flags"}[28d]))
            -
            sum(increase(http_timer_count{app="feature-flags",code!~"5.."}[28d]))
         )
      )
      /
      ( sum(increase(http_timer_count{app="feature-flags"}[28d])) * .01 )
One really useful thing about recording rules is that you use the record field to set a new name for the resulting metrics series. We took advantage of this
to make what we thought would be nice, easy metrics for our users to query.
One challenge here was that we now had to get really good at generating these queries. We didn’t want our users to have to write these by hand. Luckily, we had already built a fantastic Platform that was already integrated with the Prometheus Operator so we were all set to generate per-app recording rules automatically.
All we expected of our users was to set some very basic configuration in their WAML™ and we would do the rest. They could either set this by hand or by using the UI that is shown at the top of the article.
So the developer experience looked like this:
- Configure the WAML™ slo section. Ex:
deploy: wsf-prod-1-gke1-west3: slo: requestSpec: http: availability: percent: "99" - Deploy the application
- Chart and alert on the metric that is now recorded by Prometheus.
While we won’t cover the methodology here, the DevX team at Weave was also able to take the basic configuration above and use it to generate per-application dashboards for SLOs. This made it really easy for the developer to see the state of their application at a glance. This was another thing we actually did correctly right from the start. It’s one thing to generate automatic metrics and alerts, but it’s a much better thing to generate ready to use and personalized dashboards. Going all-in on custom dashboards from the start made SLOs more approachable.
Again, this all seems great. But we are only at attempt 2. What problems could possibly be left? Why not just stop here?
Performance At Scale
So, it turns out that our measured performance times for queries didn’t work for all our applications. Not only did the query for some microservices take a long time, but some of them actually had so many individual metrics series that we started seeing a new error in the Prometheus logs:
query processing would load too many samples into memory in query execution
The recorded metrics for those services would have gaps or stop being recorded entirely.
In short, yes we had reduced the query data scope down to where it was runnable most of the time. But there were still cases that needed to handle so much data at once. While there is a flag in
Prometheus which can used to increase this limit, The default limit is 50000000 or 50 million which is already incredibly high. We could
increase it, but that would only have postponed the issue and it would have had a significant impact on our Prometheus memory usage.
So, back to the drawing board: We knew that we wanted to keep using recording rules. But we needed to be smarter about them.
Attempt 3: Add Some (Bad) Aggregation
This is actually the place we were at when I presented at the Utah Kubernetes Meetup on SLOs in practice and at scale. If you want a more detailed breakdown please feel free to watch that recording, although please do ignore the “final” rules and come back here to part 4 to see how we finally got it right.
So, we had built a pretty good system. Our users loved how easy it was to set up an SLO and they enjoyed their automatic dashboards. But we had some services that stopped working due to the sheer size of the data involved. So we needed to find a way to keep the good but improve our performance for the bad.
The answer? More recording rules of course! While reading the Prometheus documentation we noticed something interesting. The quote is below, with our own added emphasis to highlight the part we cared about:
Recording and alerting rules exist in a rule group. Rules within a group are run sequentially at a regular interval, with the same evaluation time. The names of recording rules must be valid metric names. The names of alerting rules must be valid label values.
This is important to us because we noticed a lot of duplication in our queries. Take our sample query:
(
   ( sum(increase(http_timer_count{app="feature-flags"}[28d])) * .01 )
   -
   (
      sum(increase(http_timer_count{app="feature-flags"}[28d]))
      -
      sum(increase(http_timer_count{app="feature-flags",code!~"5.."}[28d]))
   )
)
/
( sum(increase(http_timer_count{app="feature-flags"}[28d])) * .01 )
Notice that sum(increase(http_timer_count{app="feature-flags"}[28d])) shows up no less than 3 times in that one query. What if we used a recording rule to
save the result of that query as it’s own metric? Then we could re-use that value in the SLO budget calculation. That had to reduce the overhead
because it reduced duplication. And of course, since we had a new shiny toy, we were going to use it for everything!
New Per-App Record rules
We would use a rule to calculate the total number of requests for each service and save it to a new metric.
- record: slo:feature_flags:request:http:availability:total
  expr: |
        sum(increase(http_timer_count{app="feature-flags"}[28d]))
We could then use a rule to calculate the number of budgeted failure events. Notice
how we can now use the total instead of repeating the query here?
- record: 'slo:feature_flags:request:http:availability:budgeted'
  expr: |
        (slo:feature_flags:request:http:availability:total * .01)
Then we could use another rule to calculate the number of failed events and
we re-use the total to save processing time. Notice that we use the total here to
calculate the failed We do it this way because we want to avoid NaN results from Prometheus
when we try to calculate this metric for services where sum(increase(http_timer_count{app="feature-flags",code!~"5.."}[28d])) has no results
- record: 'slo:feature_flags:request:http:availability:failed'
  expr: |
    (
      slo:feature_flags:request:http:availability:total
      -
      sum(increase(http_timer_count{app="feature-flags",code!~"5.."}[28d]))
    )
Finally, we could use the 2 middle metrics to calculate the budget.
- record: 'slo:feature_flags:request:http:availability:error_budget'
  expr: |
    (
     slo:feature_flags:request:http:availability:budgeted -
     slo:feature_flags:request:http:availability:failed
    )
    /
    slo:feature_flags:request:http:availability:budgeted
This all seems pretty great. We have this smaller re-usable bits of data we were generating. This means that we had further reduced the number of metrics that Prometheus had to query at any one time down to 1/4 of what it used to be since we were doing that aggregation early.
So, yet again, why not stop here? This seems pretty great. We have these long rules, but they are at least simple and readable they are also more performant right? So this should be all we need.
Everything seemed great, but we had two major issues: performance and occasional unexplainable values.
Performance
It turns out that we still had metrics with such high cardinality that we were unable to run the first total rule
for the past 28 days.
It turns out that even simple queries like this sum(increase(http_timer_count{app="feature-flags"}[28d])) would still sometimes be too big.
This almost always occurred with the latency SLO Budget for high-scale services. Especially services that did a lot of autoscaling since that meant that over 28 days the sheer number of different data series would explode well beyond the 50 million query sample limit in Prometheus. So even with this level of aggregation, we had too much data!
Occasional Unexplainable Values
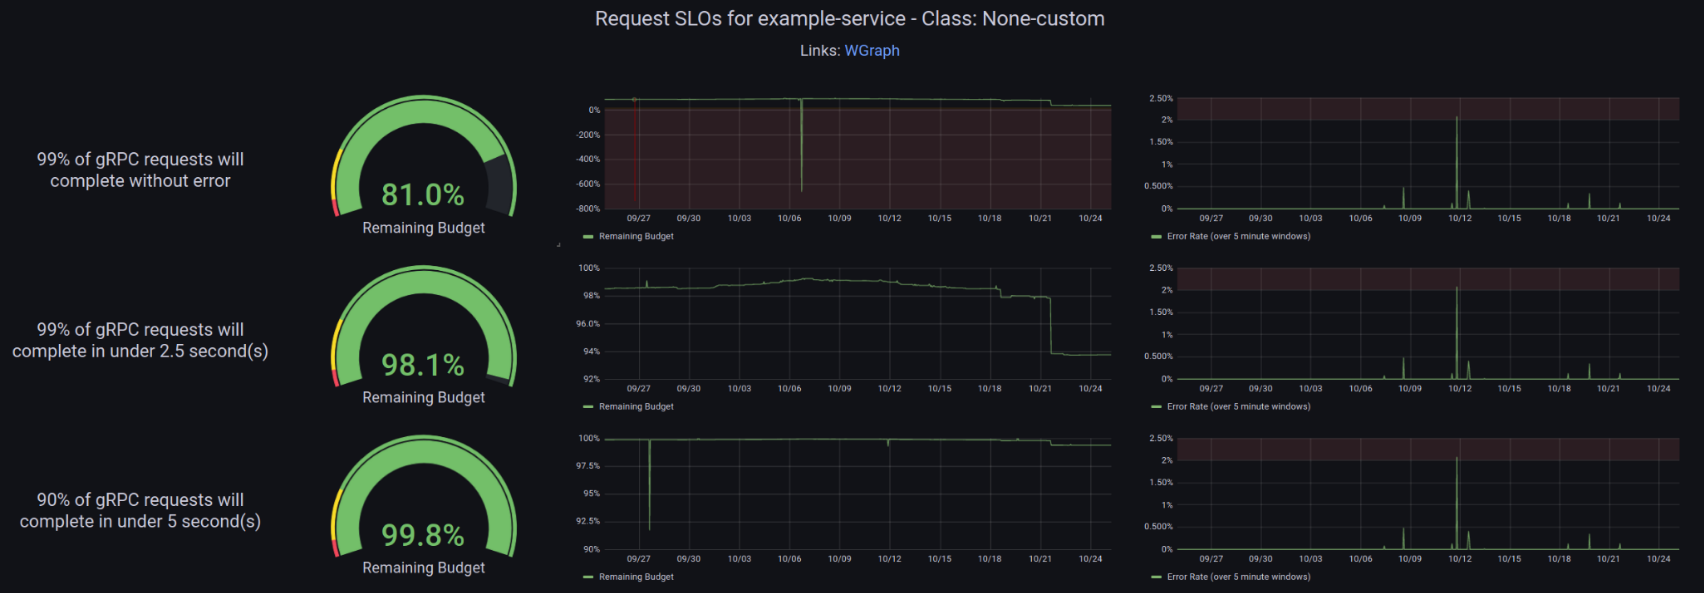
Perhaps worse than slow metrics was the fact that our graphs would often show sudden, sharp drops in remaining budgets that, and as far as we could tell, never actually related to other metrics. Even more strange was that those drops would only appear on the chart for a moment and then the budget would pop right back to where it was. You can actually see this in our “generated dashboard” image from a bit earlier in the article.
These kinds of unexplainable events eroded trust in the system so they were a major issue for us. Luckily we were eventually able to identify the issue. It turns out we had made one fundamental mistake in our use of recording rules: relying on timing.
Recording Rules and Timing
Recording rules in a group are run sequentially, just like the Prometheus docs say. But it turns out that there is one very important caveat: Recording rules are not saved back to Prometheus as a group, they are saved as they are completed. The data for each rule is also fetched only when that rule is executed.
Why does this matter? Well, this means that while it’s safe to have Prometheus rules depend on each other. (meaning you can build one record rule off another just fine), it can be very dangerous to have multiple rules in a group relate to each other. Which is exactly what our rules above do. They build 3 different rules where the 3 rules each take data from the same source metric. But remember each time a rule runs, all the data re-fetched using the latest metrics at the exact time that rule is executed.
The gist is that each recorded rule was calculated at a different time and stored at a different time. So a theoretical Prometheus rule evaluation would go like this:
9:00:00 AM- calculate thetotaland save it9:00:10 AM- calculate thebudgetedand save it9:00:20 AM- calculate thefailedand save it9:00:30 AM- calculate theerror_budgetand save it
Now, in reality the time between each step isn’t usually as long as 10 seconds for each rule. But the critical part to notice here is that there is time between each calculation. Why is that important? Well, what if something really important happens in the time between two steps?
In our case, that really important thing was metrics being marked as stale. By default, when a data source goes away, Prometheus will stop tracking that series and queries that use it for 5 minutes. This is a good thing and it allow Prometheus to simply not track or store metrics that are not longer being actively scraped.
It turns out, that this is where our unexplainable values were coming from. We were not properly comparing one data set to another. Let’s play through the 4 steps above, but with some fake values.
First, let’s imagine that we have some basic data in prometheus like this:
http_timer_count{app="feature-flags", instance="feature-flags-1", code="200"} 103
http_timer_count{app="feature-flags", instance="feature-flags-1", code="500"} 100

http_timer_count{app="feature-flags", instance="feature-flags-2", code="200"} 130
http_timer_count{app="feature-flags", instance="feature-flags-2", code="500"} 10

http_timer_count{app="feature-flags", instance="feature-flags-3", code="200"} 124
http_timer_count{app="feature-flags", instance="feature-flags-3", code="500"} 1
Get the total
9:00:00 AM- calculate thetotal- Given the sample data above, you can see that the
total = 103 + 100 + 130 + 10 + 124 + 1 = 468- Remember: Our total includes all success and failure metrics
- Given the sample data above, you can see that the
Get the budgeted
9:00:10 AM- calculate thebudgeted- Given the sample data above and a objective of
99%, you can see that thebudgeted = total * .01 = 46
- Given the sample data above and a objective of
Now pretend that in the time between the first step and the next step, the metrics for instance="feature-flags-2" get dropped.
Prometheus has already queried and saved the total but we still have 3 steps left! This is an issue
because we are going to try and relate one data set to another but we are only operating on 2/3 of the data:
http_timer_count{app="feature-flags", instance="feature-flags-1", code="200"} 103
http_timer_count{app="feature-flags", instance="feature-flags-1", code="500"} 100

http_timer_count{app="feature-flags", instance="feature-flags-3", code="200"} 124
http_timer_count{app="feature-flags", instance="feature-flags-3", code="500"} 1
Get the failed
9:00:20 AM- calculate thefailedas1failed = (total - successful) * budget_as_decimalfailed = (468 - (103 + 124)) * .1failed = 24.7
This value is wrong! It is too high. We should still be considering the 130 successful
requests from instance="feature-flags-2" since we counted that instance when we calculated the total
If we did it with all the data we would included 130 in the “successful” summary
failed = (total - successful) * budget_as_decimalfailed = (468 - (103 + 124 + 130)) * .1failed = 11.1
So, that untimely metric drop just made it seem like we are twice as bad as we actually were.
Get the budget
9:00:30 AM- calculate theerror_budgetbudgeted = (budgeted - failed)/ budgetedbudgeted = (46 - 24) / 46budgeted = .478 = 47.8% remaining
Again, this is wrong! Lets try again with the right failed number
budgeted = (budgeted - failed)/ budgetedbudgeted = (46 - 11) / 46budgeted = .76 = 76% remaining
Summary
So yes, the time between recording a value and the using it means that you can get highly volatile results. And even more confusing, the remaining SLO budget will basically instantly pop right back up to the right value the next time they rule set runs because you might get lucky and not have a any series dropped between your rules.
By trying to relate multiple recording rules to each other we ended up with a race condition during every single rule evaluation. And at high enough scale, even rare things happen all the time.
Attempt 4: Get It Right 🎉 Beware of Aggregation!
So now we have made it to what is, so far, the final attempt at SLOs here at Weave. We can say that we are
immensely more confident in our current system then we were in any of the 3 that came before it. Most of that
newly earned confidence comes from the knowledge we gained by failing so many times.
It turns out that we were correct about using recording rules to handle scaling problems. It’s just that we
really misunderstood them and abused them.
November 2023 Update
The rules in this section still have one major drawback Click here to jump to the our final attempt to see what it is.
Recording Rules Done Right
So our biggest blunder came with our very first usage of recording rules. Well, let’s take our first rule from the Attempt 3 section
and analyze it:
groups:
- name: slos
  interval: 1m
  rules:
  - record: slo:feature_flags:request:http:availability:slo:total
    query: sum(increase(http_timer_count{app="feature-flags"}[28d]))
Why is this a bad candidate for a recording rule? The main reason is that the rule here does very little to actually constrain
the data. The query is still operating on our original, full-cardinality source metric of http_timer_count. That means
that no matter what we do, every 1 minute Prometheus will need to load every single data series that matches http_timer_count{app="feature-flags"}
into memory in order to do the increase and sum on it.
It turns out that what we were really missing here is to use the recording rules for aggregation of the high cardinality metrics. This is where
they really start to shine.
First, I’ll give you the new recording rules we use to aggregate for all apps at once.
You absolutely can copy and paste these rules and use them in your own SLO generation. They scale
very well and can be useful on their own.
The rules below are fine for aggregating data but should not be used inside an increase function.
Click here to jump to the our final attempt to see why you should
be careful with aggregation rules
groups:
- name: slo-sum.rules
   interval: 1m
   rules:
   - record: slo_calc:http:code:sum
      expr: sum(http_timer_bucket{le="+Inf"}) by (app,code)
   - record: slo_calc:http:time:sum
      expr: sum(http_timer_bucket) by (app,le)
   - record: slo_calc:grpc:code:sum
      expr: sum(grpc_timer_bucket{le="+Inf"}) by (app,code)
   - record: slo_calc:grpc:time:sum
      expr: sum(grpc_timer_bucket) by (app,le)
“Wait, I thought it was a bad idea to do calculations for all apps at once” you might say. Well, this rule is a bit different. This rule
is not looking at a range vector. It is only looking at the current data.
Notice how there is no [28d] in any query? That means that when each of these rules run, they only have to load all the metrics for the current moment.
So what do those rules actually do? In this case they do aggregation of data. That is one of the main reasons recording rules even exist. Here is how one of the rules looks in detail, but they all work the same way.
   - record: slo_calc:http:code:sum
      expr: sum(http_timer_bucket{le="+Inf"}) by (app,code)
When this rule is executed, Prometheus executes the query sum(http_timer_bucket{le="+Inf"}) by (app,code) and gets all of the resulting series. It then saves all of the results
to a new metric named slo_calc:http:code:sum. This is best illustrated using specific example metrics:
http_timer_bucket{app="feature-flags", instance="feature-flags-1", le="1", code="200"} 10
http_timer_bucket{app="feature-flags", instance="feature-flags-1", le="+Inf", code="200"} 15
http_timer_bucket{app="feature-flags", instance="feature-flags-1", le="1", code="500"} 3
http_timer_bucket{app="feature-flags", instance="feature-flags-1", le="+Inf", code="500"} 17

http_timer_bucket{app="example-service", instance="example-service-1",  le="1", code="200"} 2
http_timer_bucket{app="example-service", instance="example-service-1",  le="+Inf", code="200"} 7
http_timer_bucket{app="example-service", instance="example-service-1",  le="1", code="500"} 3
http_timer_bucket{app="example-service", instance="example-service-1",  le="+Inf", code="500"} 13
Given our recording rule, the resulting metrics that would be saved back into Prometheus would look like this:
slo_calc:http:code:sum{app="feature-flags", code="200"} 15
slo_calc:http:code:sum{app="feature-flags", code="500"} 17

slo_calc:http:code:sum{app="example-service", code="200"} 7
slo_calc:http:code:sum{app="example-service", code="500"} 13
Even in this small test case you can see that the recording rule reduced the number of metrics series by half. And you can also see that the instance no longer matters. If we run this same recording rule and our instances are different (say a Kubernetes pod was replaced) the resulting cardinality of slo_calc:http:code:sum doesn’t change! Essentially, a good recording rule aggregates data. It flattens your metrics down to the bare minimum amount of data you need to use later.
So for example, looking at the latest Weave production numbers there are 137354 total different metrics series for http_timer_bucket. But, the count of sum(http_timer_bucket{le="+Inf"}) by (app,code) is only 545 different metrics series! That is 3 orders of magnitude less data. And even better, the number of individual series for this metric won’t explode as apps are restarted since we are flattening instance or pod_name out
and essentially discarding it. Yes, we lost some data in the process. For example, we won’t be able to use this aggregated data to get a per-pod SLO now, but we never wanted that before.
In theory, we could take these new, aggregated rules and actually use them in our very first query. The one that was impossible to even run when it used the full data.
(
   ( sum(increase(slo_calc:http:code:sum[28d])) by (app) * .01 )
   -
   (
     ( sum(increase(slo_calc:http:code:sum[28d])) by (app) )
     -
     ( sum(increase(slo_calc:http:code:sum{code!~"5.."}[28d])) by (app) )
   )
 )
/
( sum(increase(slo_calc:http:code:sum[28d])) by (app) * .01 )
This query takes about 12 seconds to run against our production Prometheus. But still, we went from impossible to execute to something that works. If that isn’t a sign of doing something right, then what is? But of course, even if this does run, we weren’t about to lose all the value we got from our custom generated rules and per-app objectives. So instead, we took our new aggreated dataset and used in those rules.
Per-app Rules Done Right Wrong
Update as of November 2023
These rules have a major flaw and should not be used. Instead, please click here to jump to the our final attempt to see why these rules are still wrong and how to get it right.
Now we have some nice, clean and minimal data. But we still need to generate per-app rules because we still want to be able to use the aggregated rules to calculate a per-app objective based on the developer provided configuration.
So, we kept the WAML™ configuration as it was. After all, we liked the minimal system that developers used to define SLOs, we just had to iterate a lot on getting them right on our end. But, instead of our last system, where we generated slo calculations one part at a time and then tried to relate those parts to each other, we essentially did our “big” query, just for one app at a time.
Here is an example rule for our feature-flags http availability SLO that uses the pre-aggregated slo_calc:http:time:sum metric.
groups:
- interval: 3m
  name: feature-flags.slo.rules
  rules:
  - record: slo
    expr: |
         (
            sum(increase(slo_calc:http:code:sum{app="feature-flags"}[28d])) * .05)
            -
            (
               sum(increase(slo_calc:http:code:sum{app="feature-flags"}[28d]))
               -
               sum(increase(slo_calc:http:code:sum{app="feature-flags",code!~"5.."}[28d]))
            )
         )
         /
         (sum(increase(slo_calc:http:code:sum{app="feature-flags"}[28d])) * .05
    labels:
      app: feature-flags
      objective: availability
      description: 99.99% of grpc requests will complete without error
      type: http
There are a few things to notice here:
This query looks a lot like the query from Attempt 2.
- That’s because it’s basically the same query. The huge difference here is that we are using the pre-aggregated metrics data, so this query is constrained to never reach excessive cardinality.
The record name is simpler and labels are being set.
- It turns out that when you start adding a lot of highly specific data to a metrics name you are probably doing something wrong.
- By using
labelsto hold this kind of specific data, you make the resulting metrics much easier to query all your recorded results.
The result might look something like this:
slo{app="feature-flags", objective="availability", type="http"} .7
The value of this metric is made-up and in reality would depend on the values of the last 28 days worth of data for slo_calc:http:code:sum. But hopefully
you see how the combination of recording rules and adding of labels allows us to take the massive, raw data and reduce it to a small, dataset where we preserve only the
data we need, or even add extra data. Notice how we were able to add domain specific terms like objective and type to the resulting slo metric, even though the original data never had those labels.
Now, anyone at Weave could quickly and easily view the state of all http availability objectives across all apps using a trivial Prometheus query: max(slo{type="http", objective="availability"}) by (app) and the query
would run very quickly since it would not need to parse the massive amounts of raw data, but instead just query the recorded data.
With metrics like this we are able to quickly and easily add slo data to our standard metrics dashboard. We were able to stop generating custom dashboards and just use standard grafana features to get the same value:
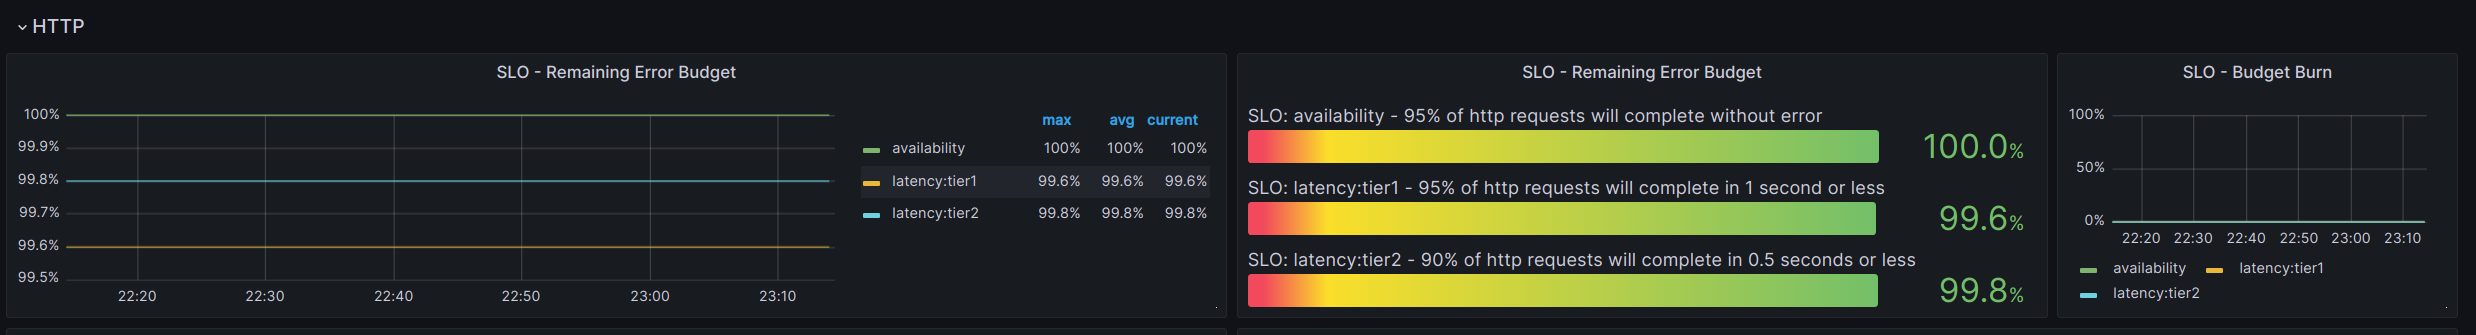
Not only is this data readily queryable, but it is fast and responsive in a dashboard which makes it much more likely to be used and monitored!
So that’s the full story of how it took 4 full iterations on our SLO system for the Developer Experience team at Weave to build a system that felt good to use and scaled up to handle our most volatile and highest scale services. 🎉 Hopefully you are able to just take our final implementation and use it to build your own SLO system without having to deal with all the headaches we did.
Attempt 5: Keeping It Simple
Call it Ego, hubris, or maybe just fate but about 7 months after publishing this article, we are back at it doing an update to explain how what we thought was a perfect system still had one major flaw.
For a spoken version of this section please check out our Cloud Native Rejekts talk on SLOs
The Discovery
While our usage of recording rules to sum data before processing was a valid use of recording rules, there was one major issue with the new calculations.
For the last 7 months they seemed to work well. But we still had occasions where developers would get alerts for SLOs that didn’t seem to correspond to actual increases in violations.
We didn’t have any more random spikes in data but occasionally it could not be explained. This issue was actually discovered by Kyle Brown an SRE here at Weave. It was
discovered while we were in the process of migrating to Victoria Metrics, an alternative metrics provider with a fully Prometheus-compatible API. Many of our SLO calculations looked
dramatically different when viewed in Victoria.
The Big Mistake
It turns out that we made one big mistake. To understand it let’s look at a single portion of our sample slo query:
sum(increase(slo_calc:http:code:sum{app="feature-flags"}[28d])) * .05)
On face value this seemed like a valid replacement. After all, slo_calc:http:code:sum came from http_timer_count so it should be a valid drop-in replacement right? Wrong.
The key here is to look at the docs for the increase function in prometheus
increaseshould only be used with counters and native histograms where the components behave like counters.
This is important because the value of slo_calc:http:code:sum is not a counter and does not behave like one! A fundamental aspect of Prometheus is that you always increase and then sum. And what we were doing was effectively
a sum then increase and then sum again. This resulted in the query being unable to account for resets.
Key Takeaway: Be Careful When Using A Recording Rule In A Query
You would think that after attempt 3 we would have learned out lesson. But we did not. Recording rules are immensely useful in Prometheus but any time you use them in more complex queries you have to be careful. One thing we could have done earlier would have been to take our query and substitute in a filtered version of the recording rule:
So, given the query:
sum(increase(slo_calc:http:code:sum{app="feature-flags"}[28d])) * .05)
And a recording rule of:
   - record: slo_calc:http:code:sum
      expr: sum(http_timer_bucket{le="+Inf"}) by (app,code)
If we substitute slo_calc:http:code:sum for the query-specific equivalent of sum(http_timer_bucket{le="+Inf", app="feature-flags"}) by (app,code) we get the following actual effective query of:
sum(increase(sum(http_timer_bucket{le="+Inf", app="feature-flags"}) by (app,code)[28d])) * .05)
The issue now becomes immediately obvious! We are doing a sum before increase and breaking a fundamental rule of Prometheus. This explains the confusing results we would get when many data sources would come up and go down
around the same time.
Back To The Drawing Board
So, now we know we can’t use aggregation rules the way we were doing it before. How do we go about calculating SLOs when we still have so much data?
We went back to our original query from step 2:
(
   ( sum(increase(http_timer_count{app="feature-flags"}[28d])) * .01 )
   -
   (
      sum(increase(http_timer_count{app="feature-flags"}[28d]))
      -
      sum(increase(http_timer_count{app="feature-flags",code!~"5.."}[28d]))
   )
)
/
( sum(increase(http_timer_count{app="feature-flags"}[28d])) * .01 )
Step 1 - Simplify your query!
It turns out that if you can use some very basic algebra to simplify our initial formula and eliminate duplicated terms:
(budgeted - failed)         failed
------------------- = 1 - ----------
     budgeted              budgeted
That query change eliminates some duplication from our queries we now only need to get the budgeted value twice. Which gives a query like this:
1 -
(
   (
      sum(increase(http_timer_count{app="feature-flags"}[28d]))
      -
      sum(increase(http_timer_count{app="feature-flags",code!~"5.."}[28d]))
   )
)
/
( sum(increase(http_timer_count{app="feature-flags"}[28d])) * .01 )
Step 2 - Use vector
The next thing we did was realize that we have better ways of handling cases where an app has had zero failed requests for the watch period. Previously we handled this by taking the total
number of requests and subtracting the good requests. But this again requires us to get the total and is completely unnecessary.
Instead we can switch the !~ to a =~ and just use vector(0) to tell Prometheus to treat no data as a 0 instead of returning nothing. This is a massive simplification and takes out the last extra
calculation of the total. So our final query for an app looks something like this:
1 - (
  sum(increase(http_timer_count{app="feature-flags",code=~"5.."}[28d])) or vector(0)
  /
  ( sum(increase(http_timer_count{app="feature-flags"}[28d])) * .01 )
)
Notice how we now have the simplest version of the query possible. Where each value is only calculated once. This solved our performance issues for most of our services!
Step 3 - Deal With Data Scale
Now that we had realized that recording rules which use sum are not a valid way to do data aggregation we had to go back to basics to deal with scale. The truth was that even our final, simplified, optimized
query was still not able to complete for apps with very, very high cardinality. With our newfound Prometheus knowledge we came up with a few alternatives
Scale Option - Reduce Range
While this wasn’t ideal. We did throw out the idea of essentially giving up and just reducing our SLO range. By reducing our target from 28d to 14d we would effectively cut the amount of data we had to process in half.
This was a basic and easy solution but we didn’t want to resort to it but we did present it as an option. Had we gone this route, an example rule would look like this:
1 - (
  sum(increase(http_timer_count{app="feature-flags",code=~"5.."}[14d])) or vector()
  /
  ( sum(increase(http_timer_count{app="feature-flags"}[14d])) * .01 )
)
The big downside here is that our SLOs would effectively have a “shorter memory” so things like major outages would be cleared from the budget after two weeks. This itself isn’t an issue but our goal was to do 28 days because we want to make sure that any impact felt by a customer has 4 full weeks before it is no longer considered when making product decisions. Our goal was 28 days from the start and we wanted to hit that goal.
Scale Option - Downsample With Recording Rules
Of course, another option was to turn back to recording rules. But, do so correctly this time. Rather than use a rule to do aggregation of data, we could use a rule to simply re-record existing data under a new name, but far less often. Some example recording rules we came up with:
groups:
- name: slo-downsample.rules
   interval: 5m
   rules:
   - record: http_timer_bucket:downsample
      expr: http_timer_bucket
   - record: grpc_timer_bucket:downsample
      expr: grpc_timer_bucket
These rules might seem the same as our ill-fated sum rules but they are very different. The first thing is that the interval is increased from 1m to 5m. The second is that there is no aggregation manipulation of
data in the query. All that these two rules do is run every 5 minutes and copy all the data from a source rule into a different series name.
The end result is that Prometheus has two duplicated metrics, but those metrics have 5 times less resolution which means that there is 5 times less data for a query to process. Had we gone this route, an example rule would look like this:
1 - (
  sum(increase(http_timer_bucket:downsample{app="feature-flags",code=~"5.."}[28d])) or vector(0)
  /
  ( sum(increase(http_timer_bucket:downsample{app="feature-flags"}[28d])) * .01 )
)
Note: The big difference between our past usage and this usage of recording rules is that this usage passes the substitution test.
If we take
sum(increase(http_timer_bucket:downsample{app="feature-flags"}[28d]))and substitute the record rule, we get
sum(increase(http_timer_bucket{app="feature-flags"}[28d]))Because we are not doing a
sumin the rule you can see that this really is a case of safe replacement.
The only real issue with this method is that slo rules take up to 5 minutes from the time the original metric is recorded to accurately represent changes. This delay would be confusing to users. But outside that minor issue it would be a viable solution and likely what we would have done if we had not already been in the process of switching to a different, Prometheus-compatible provider.
Scale Option - Change Providers
Prometheus is a fantastic, low-overhead system and it has done amazing things when it comes to re-thinking how monitoring works. But since it’s inception there have been other open-source and proprietary projects that can ingest data the same way as Prometheus and even have api endpoints that accept promQL. This makes it easy to switch providers without changing all your code and dashboards.
As mentioned at the start of this section, Weave was already in the process of migrating to Victoria Metrics. That is what caused our old queries to jump out as incorrect. So in the end the solution we implemented was to move to a different provider that has more management overhead but scales a lot higher. When we ran our new, simplified queries against the new provider we had no issues at all with scale!
Summary
Hopefully there are no updates to this article in the future and the SLO system can remain stable as Weave continues to grow and scale out. We hope that this article helps you to push past any issues you might hit now that we have provided some solid examples of what to do, and maybe more importantly: what not to do.